|
This page contains a sample of some of the information that we have discovered from looking at the ECU code. For more detailed information, click on the Analysis link in the ECU ROM images section.
Subaru EG33 ECU Parameter addresses
Thanks to TomsSVX for extracting these addresses using his Select Monitor and an Eavesdrop Cable. These are the addresses that should be entered into your datalogging software.
| Mode | Address | Parameter | Formula |
| F00 | 8C3D-8C3F | ROM ID NUMBER "YEAR" | See "ROM Images" |
| F01 | 102F | BATTERY VOLTAGE | volts=value*0.08 |
| F02 | 1071 | VEHICLE SPEED (mph) | mph=value*1.25 |
| F03 | 1071 | VEHICLE SPEED (km/h) | km/h=value*2 |
| F04 | 106F | ENGINE SPEED | rpm=value*25 |
| F05 | 1185 | WATER TEMP (F) | tempF=(value-82)*9/5 |
| F06 | 1185 | WATER TEMP (C) | tempC=value-50 |
| F07 | 10A2 | IGNITION TIMING | advance=value |
| F08 | 1283 | AIRFLOW SENSOR | airflow%=(value*100)/255 |
| F09 | 1282 | LOAD DATA | load=value |
| F10 | 128C | THROTTLE POSITION SENSOR | throttle%=(value*100)/255 |
| F11 | 1280 | INJECTOR PULSE WIDTH | msec=value*256/1000 |
| F12 | 129D | BY-PASS AIR CONTROL | duty%=(value*100)/255 |
| F13 | 1291 | 02 RIGHT HAND | mV=value*5000/512 |
| F14 | 1292 | 02 LEFT HAND | mV=value*5000/512 |
| F15 | 12B0 | 02 R MAX | mV=value*5000/256 |
| F16 | 12B1 | 02 R MIN | mV=value*5000/256 |
| F17 | 12B2 | 02 L MAX | mV=value*5000/256 |
| F18 | 12B3 | 02 L MIN | mV=value*5000/256 |
| F19 | 1097 | AFR CORRECTION 1 | afc=value-128 |
| F20 | 109F | AFR CORRECTION 2 | afc=value-128 |
| F21 | 12A7 | KNOCK CORRECTION | correction=value |
| F22 | 12A5 | CANISTER PURGE CONTROL | duty%=(value*100)/255 |
| F23 | 125F | ATMOSPHERIC PRESSURE | |
| FB0 | 1026-1029 | DIAG. READ | See "Reading Error Codes" |
| FB1 | 12B9-12BC | DIAG. MEMORY | See "Reading Error Codes" |
|
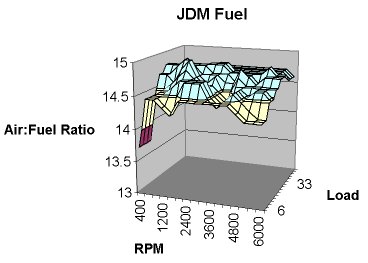
Fuel and Timing Maps
The fuel map is 16x16 bytes at 8120. The X axis (load) is at 8110 and the Y axis (rpm) is at 8100. The lookup is done by a subroutine at 913D that interpolates between the points on the graph.
| 0x8120 | Load | |
| RPM |
| | 06 | 0A | 0C | 10 | 12 | 14 | 17 | 1A | 1F | 21 | 26 | 28 | 2B | 2D | 32 | 37
| | 08(400) | 89 | 89 | 89 | 89 | 84 | 82 | 80 | 80 | 7F | 7F | 80 | 80 | 80 | 80 | 80 | 80 |
| 0C(600) | 82 | 82 | 82 | 82 | 82 | 82 | 80 | 80 | 7F | 7F | 80 | 80 | 80 | 80 | 80 | 80 |
| 10(800) | 82 | 82 | 82 | 82 | 82 | 81 | 81 | 7F | 7F | 7F | 80 | 80 | 80 | 80 | 80 | 80 |
| 18(1200) | 83 | 83 | 82 | 81 | 81 | 80 | 7F | 7E | 7E | 7F | 80 | 80 | 80 | 80 | 80 | 80 |
| 20(1600) | 84 | 84 | 82 | 80 | 80 | 7F | 7E | 7E | 7F | 7F | 7F | 80 | 80 | 80 | 80 | 80 |
| 28(2000) | 82 | 82 | 80 | 80 | 80 | 80 | 80 | 80 | 80 | 7F | 7F | 7F | 80 | 80 | 80 | 80 |
| 30(2400) | 82 | 82 | 80 | 80 | 80 | 81 | 81 | 81 | 80 | 80 | 7F | 7F | 7F | 80 | 80 | 80 |
| 38(2800) | 82 | 82 | 80 | 80 | 80 | 81 | 81 | 80 | 80 | 80 | 7F | 7F | 7F | 80 | 80 | 80 |
| 40(3200) | 82 | 82 | 82 | 82 | 82 | 82 | 82 | 82 | 81 | 80 | 80 | 80 | 80 | 80 | 80 | 80 |
| 48(3600) | 82 | 82 | 83 | 83 | 83 | 83 | 83 | 82 | 81 | 81 | 80 | 80 | 80 | 80 | 80 | 80 |
| 50(4000) | 82 | 82 | 82 | 82 | 82 | 82 | 81 | 80 | 7F | 80 | 80 | 80 | 80 | 80 | 80 | 80 |
| 58(4400) | 82 | 82 | 81 | 81 | 81 | 81 | 81 | 81 | 80 | 80 | 80 | 80 | 80 | 80 | 80 | 80 |
| 60(4800) | 83 | 83 | 82 | 82 | 82 | 82 | 81 | 81 | 81 | 81 | 80 | 80 | 80 | 80 | 80 | 80 |
| 68(5200) | 84 | 84 | 83 | 82 | 81 | 81 | 81 | 81 | 80 | 80 | 7F | 7F | 80 | 80 | 80 | 80 |
| 70(5600) | 84 | 84 | 84 | 82 | 81 | 81 | 81 | 81 | 80 | 80 | 80 | 80 | 80 | 80 | 80 | 80 |
| 78(6000) | 84 | 84 | 84 | 82 | 82 | 82 | 81 | 81 | 80 | 80 | 80 | 80 | 81 | 81 | 81 | 81 |
|  |
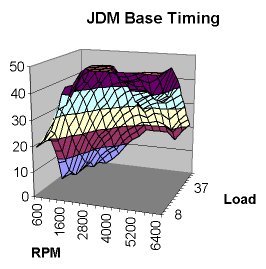
The base timing map is 16x16 bytes at 8500 with X axis at 84E0 and Y axis at 84D0. The lookup is done by the same subroutine at 913D and the data interpolated as before.
| 0x8500 | Load | |
| RPM |
| | 08 | 0C | 0F | 11 | 14 | 18 | 1C | 20 | 22 | 25 | 29 | 2C | 30 | 36 | 3A | 40
| | 0C(600) | 14 | 14 | 14 | 14 | 13 | 0E | 08 | 00 | 00 | 00 | 00 | 00 | 00 | 00 | 00 | 00
| | 10(800) | 17 | 19 | 19 | 17 | 13 | 0E | 09 | 04 | 02 | 00 | 00 | 00 | 00 | 00 | 00 | 00
| | 18(1200) | 1B | 1E | 22 | 20 | 1D | 18 | 13 | 0E | 0B | 08 | 05 | 04 | 03 | 00 | 00 | 00
| | 20(1600) | 23 | 28 | 2A | 26 | 22 | 1D | 18 | 14 | 12 | 0F | 0C | 0A | 08 | 05 | 03 | 00
| | 28(2000) | 25 | 28 | 2B | 29 | 27 | 24 | 20 | 1B | 18 | 14 | 11 | 0F | 0C | 08 | 06 | 02
| | 30(2400) | 2A | 2D | 30 | 2C | 2B | 28 | 26 | 21 | 1E | 1A | 14 | 12 | 0F | 0A | 08 | 05
| | 38(2800) | 30 | 32 | 32 | 32 | 2F | 2B | 2A | 24 | 21 | 1D | 19 | 16 | 13 | 0F | 0C | 09
| | 40(3200) | 32 | 32 | 32 | 32 | 32 | 31 | 2E | 29 | 26 | 22 | 1D | 1A | 16 | 12 | 0F | 0C
| | 48(3600) | 32 | 32 | 32 | 32 | 32 | 31 | 2E | 2A | 28 | 25 | 20 | 1C | 19 | 14 | 11 | 0E
| | 50(4000) | 32 | 32 | 32 | 30 | 2F | 2D | 2C | 2A | 28 | 26 | 24 | 1F | 1A | 16 | 14 | 11
| | 58(4400) | 32 | 30 | 2E | 2D | 2C | 29 | 26 | 23 | 22 | 20 | 1E | 1C | 19 | 16 | 14 | 11
| | 60(4800) | 32 | 30 | 2E | 2D | 2B | 29 | 27 | 25 | 24 | 22 | 20 | 1E | 1B | 17 | 14 | 11
| | 68(5200) | 32 | 31 | 2F | 2E | 2B | 29 | 28 | 26 | 26 | 24 | 21 | 1E | 1B | 16 | 14 | 11
| | 70(5600) | 32 | 32 | 31 | 2D | 28 | 26 | 25 | 24 | 23 | 22 | 21 | 1E | 19 | 14 | 12 | 0E
| | 78(6000) | 32 | 32 | 31 | 2F | 2D | 29 | 28 | 26 | 25 | 25 | 23 | 1F | 1C | 18 | 16 | 12
| | 80(6400) | 32 | 32 | 32 | 32 | 32 | 32 | 30 | 2E | 2C | 29 | 25 | 22 | 1F | 1B | 18 | 15
|
|  |
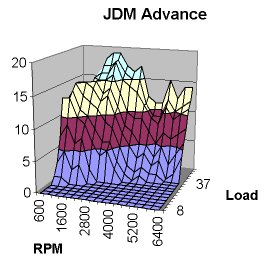
The advance map is at 8E20. It uses the same axes as the 8500 map and the lookup is done by the same subroutine at 913D. These values are added to the base timing to get the maximum advance.
| 0x8E20 | Load | |
| RPM |
| | 08 | 0C | 0F | 11 | 14 | 18 | 1C | 20 | 22 | 25 | 29 | 2C | 30 | 36 | 3A | 40
| | 0C(600) | 00 | 00 | 00 | 00 | 01 | 03 | 07 | 0D | 0C | 0B | 0A | 08 | 07 | 05 | 03 | 01
| | 10(800) | 00 | 00 | 00 | 00 | 01 | 05 | 09 | 0D | 0E | 0F | 0F | 0D | 0C | 0A | 09 | 07
| | 18(1200) | 00 | 00 | 00 | 00 | 00 | 02 | 06 | 0A | 0B | 0D | 0F | 0E | 0E | 0F | 0D | 0B
| | 20(1600) | 00 | 00 | 00 | 00 | 00 | 03 | 07 | 09 | 0A | 0C | 0E | 0F | 0F | 10 | 11 | 12
| | 28(2000) | 00 | 00 | 00 | 00 | 00 | 00 | 02 | 06 | 08 | 0B | 0C | 0D | 0F | 10 | 11 | 13
| | 30(2400) | 00 | 00 | 00 | 00 | 00 | 00 | 00 | 04 | 06 | 09 | 0D | 0E | 10 | 12 | 12 | 13
| | 38(2800) | 00 | 00 | 00 | 00 | 00 | 00 | 00 | 05 | 06 | 08 | 0A | 0B | 0D | 0F | 10 | 11
| | 40(3200) | 00 | 00 | 00 | 00 | 00 | 00 | 00 | 02 | 03 | 05 | 07 | 08 | 0A | 0E | 0F | 10
| | 48(3600) | 00 | 00 | 00 | 00 | 00 | 00 | 00 | 00 | 01 | 02 | 05 | 07 | 09 | 0D | 0F | 11
| | 50(4000) | 00 | 00 | 00 | 00 | 00 | 00 | 00 | 00 | 00 | 01 | 03 | 05 | 09 | 0B | 0B | 0C
| | 58(4400) | 00 | 00 | 00 | 00 | 00 | 00 | 00 | 00 | 01 | 02 | 04 | 05 | 07 | 09 | 09 | 0B
| | 60(4800) | 00 | 00 | 00 | 00 | 00 | 00 | 00 | 00 | 00 | 01 | 02 | 03 | 05 | 08 | 09 | 0B
| | 68(5200) | 00 | 00 | 00 | 00 | 00 | 00 | 00 | 00 | 00 | 01 | 03 | 05 | 07 | 0B | 0C | 0F
| | 70(5600) | 00 | 00 | 00 | 00 | 00 | 00 | 00 | 00 | 00 | 00 | 00 | 02 | 06 | 09 | 0A | 0C
| | 78(6000) | 00 | 00 | 00 | 00 | 00 | 00 | 00 | 00 | 00 | 00 | 01 | 04 | 07 | 0A | 0B | 0E
| | 80(6400) | 00 | 00 | 00 | 00 | 00 | 00 | 00 | 00 | 00 | 00 | 04 | 06 | 08 | 0B | 0C | 0E
|
|  |
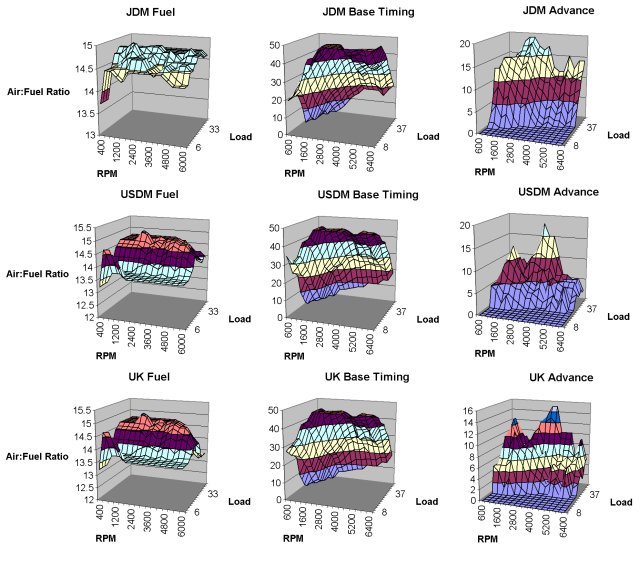
The above maps and graphs are from a JDM SVX. For comparison, here are the maps from USDM and UK cars. It can be seen that the USA and UK maps are very similar but not identical, while the JDM maps are markedly different.
|