
Introduction
Select Monitor Adapter
Subaru Diagnostic Ports
How to build a PC adapter
Protocol
Software
Troubleshooting
Eavesdropping
Engine Control Unit (ECU)
Description
Reading Error Codes
Reverse Engineering
Modifying
ROM images
Transmission Control Unit (TCU)
Description
Reading Error Codes
Reverse Engineering
Power Mode
Modifying
ROM images
Other Control Units
Air Conditioning Unit 4WS Control Unit Cruise Control Unit
OBD2 Information
Select Monitor Cartridge
Downloads
Links to other sites
Custom TCU Development

This page contains a sample of some of the information that we have discovered from looking at the TCU code. For more detailed information, click on the Analysis link in the TCU ROM images section.
Subaru 4EAT TCU Parameter addresses
Thanks to TomsSVX for extracting these addresses using his Select Monitor and an Eavesdrop Cable. These are the addresses that should be entered into your datalogging software. Your datalogging software must have TCU support. Reading these addresses from the ECU will not give meaningful results.
| Parameter | Address | Formula |
| Battery Voltage | 1044 | volts=(value*8)/100 |
| Vehicle Speed Sensor 1 | 0019 | speed=value in km/h |
| Vehicle Speed Sensor 2 | 001A | speed=value in km/h |
| Engine RPM | 00B6 | rpm=value*250 |
| ATF Temperature | 0017 | temp=(value*0.6)-25 |
| Throttle Position | 1040 | throttle%=(value*100)/255 |
| Current Gear | 004E | gear=value+1 |
| Solenoid A (Line Pressure) Duty Cycle | 00B3 | duty% = value/2 |
| Solenoid B (Lockup Clutch) Duty Cycle | 00B4 | duty% = value/2 |
| Solenoid C (4WD System) Duty Cycle | 00B5 | duty% = value/2 |
| Atmospheric Pressure | 1046 |
These extra addresses were found by inspection of the TCU program code.
|
The Shift Plan
A thread discussing the information below can be found on the SVX World Network: Gear Shift Maps Thread
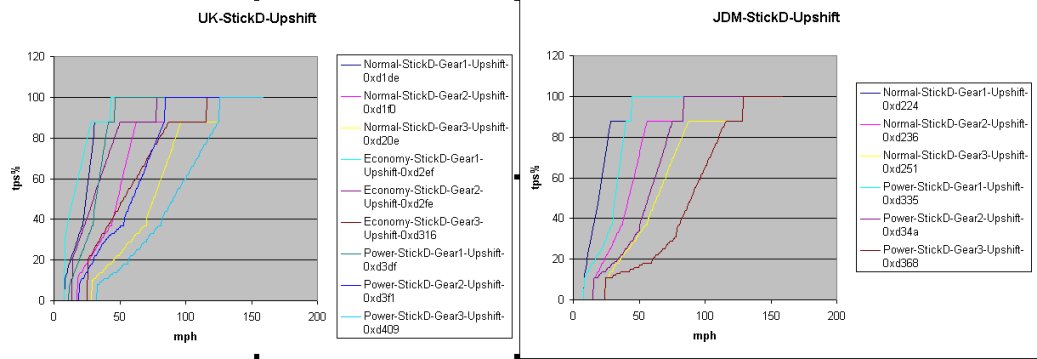
The shift plan is composed of multiple shift maps. There is one shift map for each possible combination of mode, stick position, and current gear. Each shift map is comprised of an upshift curve and a downshift curve. As an example: The UK TCU has 6 modes (Normal, Economy, Power, Manual, Cruise and Overheat). There are 4 stick positions (D,3,2,1) and obviously 4 gears (1st,2nd,3rd,4th). Therefore there are 6x4x4=92 shift maps in the shift plan.
The shifting decision is based on vehicle speed and throttle, not rpm. This is confirmed by the factory service manual. Let me demonstrate how it works with the aid of the Normal-StickD-Gear2 map and the Normal-StickD-Gear3 map.
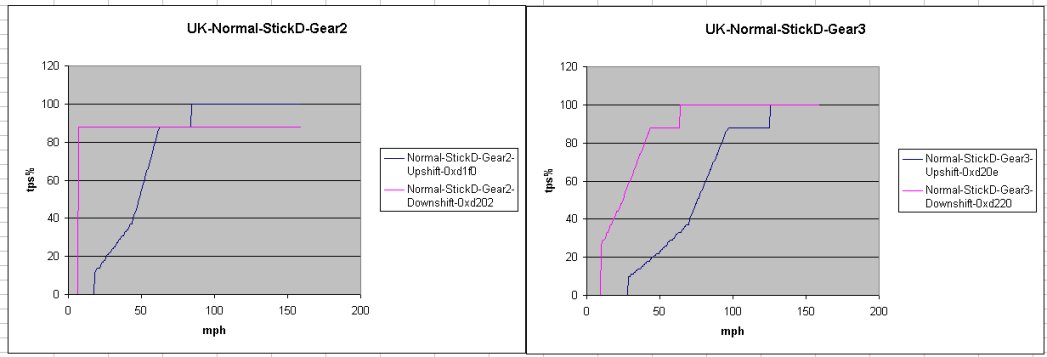
Suppose you are driving in Normal Mode, with the stick in D, at 50mph and 40% throttle. The gearbox is in 3rd gear. Imagine a dot at (50,40) on the 3rd gear map (the one on the right). If you floor the gas, the dot will move vertically up the chart. When you get to about 88% throttle, the dot crosses the downshift curve and the box changes down to 2nd gear. Now the dot is on the 2nd gear map at 100% throttle and moving right as the speed increases. When you reach 85mph the dot crosses the upshift curve and the box changes up to 3rd gear.
Here are the upshift and downshift curves for a USDM SVX in Normal mode, with the stick in D. I have superimposed the 4 maps into one diagram.
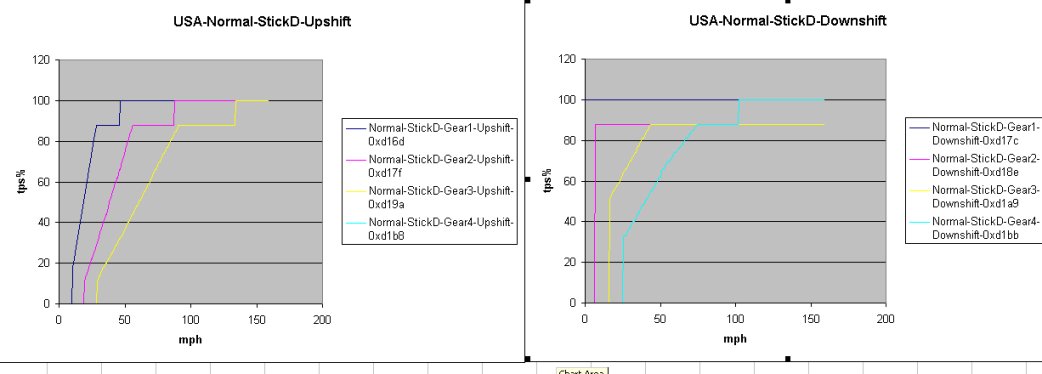
You will note that the gear1-downshift map is a horizonal line at 100% throttle, because obviously we can't downshift from 1st gear. Similarly, the gear4-upshift map is a horizonal line at 0% throttle because we can't upshift from 4th gear. If you compare the Power mode curves below, you can see that in Power mode the TCU upshifts at a higher speed, and needs less throttle push to trigger a downshift. At 60% throttle it will change from 2nd to 3rd at 64mph in Power mode compared to 43mph in Normal mode. If you squeeze the gas pedal at 50mph in 4th, Power mode will downshift at only 35% throttle whereas Normal mode requires 62%.
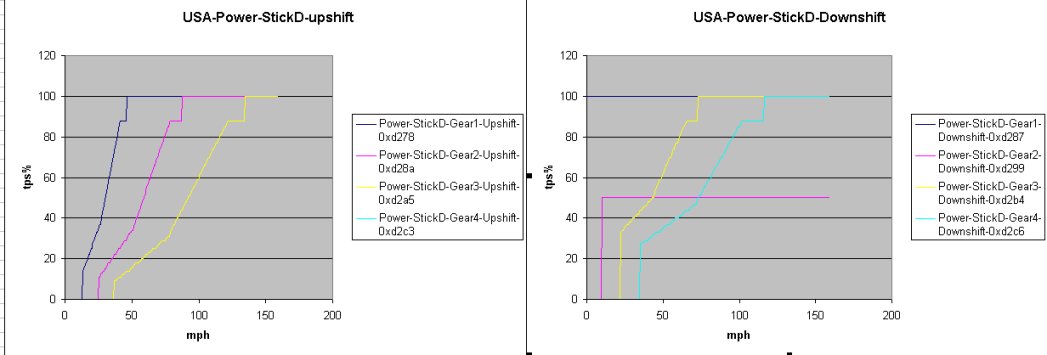
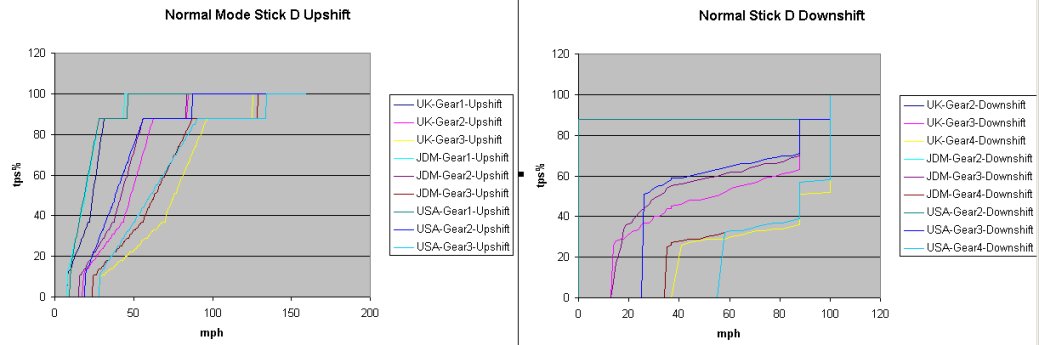
The USDM TCU is a little more complex than the UK version. It has 7 modes (Normal,Power,Manual,Cruise,LowPres1,LowPres2,Overheat) and therefore 7x4x4=112 maps. The LowPres1 mode is activated when the atmospheric pressure is low. The LowPres2 mode is activated when the atmospheric pressure is very low. The TCU uses power mode if the atmospheric pressure is very very low. I have no idea why Subaru would need different shift maps based on atmospheric pressure. Perhaps to compensate for reduced engine power at altitude? Only the USA model has this feature, the UK and JDM don't even have a pressure sensor.
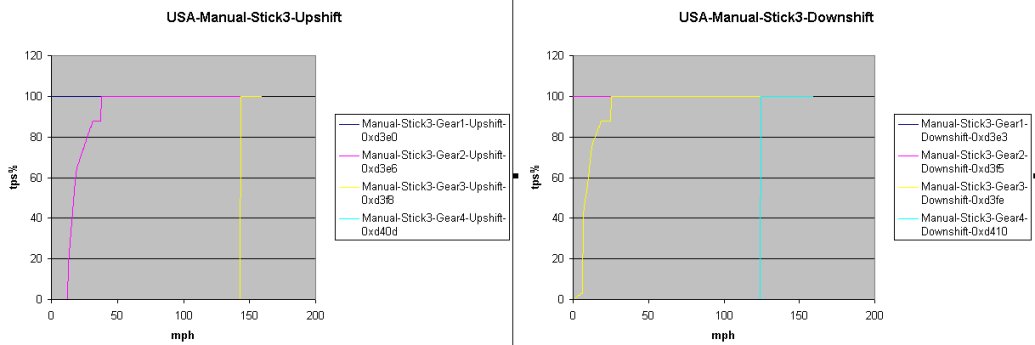
There is a FAQ on the SVX forums, "What does the manual button do?". Below are the maps for Manual Mode with the Stick in 3. You can see that the car will start in 2nd but then upshift to 3rd almost immediately and then hold 3rd right up to 143mph. On the downshift, it will hold 3rd all the way down to almost a standstill. Similarly, when the stick in is 2 (not pictured here), the car will start in 2 and hold it right up to 91mph. Essentially, Manual mode does its very best to keep you in the gear you have selected on the shifter.
The JDM model has only 5 modes (Normal, Power, Cruise, Manual and Overheat), however there is data for 2 extra maps that never seem to get used. I was expecting that the Normal and Power maps would be the same between JDM and UK models, but they are not. Here is a comparison of the upshift maps between the two models.
It appears to me that the UK Economy mode is slightly more relaxed than the JDM Normal Mode while the UK Normal Mode is slighly more aggressive than the JDM Normal Mode. ie. The JDM Normal mode is inbetween UK Economy and Normal. The UK Power mode is also more aggressive than the JDM Power mode. Below is a comparison of the UK, JDM and USA models in Normal Mode with the stick in D. When looking at this diagram it is important to remember that the USA model has a higher diff ratio and therefore lower rpm at the indicated speeds.
I have extracted the maps into a big Excel spreadsheet. This can be downloaded from the Download page if you want to have a closer look at it.
How to decode the shift maps
Using the USDM TCU ROM 705404 as an example:
First find the map you want to change:
Open the file in a hex editor and scroll down to address 0xCFAD. This is a list of 16 bit pointers to the maps. ie. It holds the start address of each map. The first map is at location 0xD16D, the second at 0xD17C, the third at 0xD17F etc.
0000CFA0   xx xx xx xx xx xx xx xx xx xx xx xx xx D1 6D D1

0000CFB0   7C D1 7F D1 8E D1 9A D1 A9 D1 B8 D1 BB D1 CA D1

0000CFC0   D9 D1 DC D1 EB D1 F7 D1 FD D2 0C D2 0F D2 15 D2
Decide which map you want to look at and work out its position in the list:
Map Number=(Mode*32)+(Stick*8)+(Gear*2)+Direction
where:
Mode: Normal=0, Power=1, Manual=2, Cruise=3, LowPres1=4, LowPres2=5, Overheat=6.
Stick: PosD=0, Pos3=1, Pos2=2, Pos1=3
Gear: 1st=0, 2nd=1, 3rd=2, 4th=3
Direction: Upshift=0, Downshift=1
This should give you a Map number between 0 and 223. The Pointer address is 0xCFAD + (Map Number * 2).
For example: The map for Power-Stick3-Gear2-Upshift: Map Number=(1*32)+(1*8)+(1*2)+0=42. Pointer Address=0xCFAD+(42*2) = 0xD001
0000D000 xx D2 E7 xx xx xx xx xx xx xx xx xx xx xx xx xx
Look in the list at address 0xD001 and you will see the address of the map is 0xD2E7. Now scroll down to 0xD2E7 and look at the map itself:
0000D2E0   xx xx xx xx xx xx xx 28 00 80 51 0C AC 7E 18 F0

0000D2F0   8B 00 F0 FF 00 FF xx xx xx xx xx xx xx xx xx xx
Here is how you decode the map:
Arrange the data into columns of three bytes like so, label them K, M and T
| K | M | T |
| 28 | 00 | 80 |
| 51 | 0C | AC |
| 7E | 18 | F0 |
| 8B | 00 | F0 |
| FF | 00 | FF |
| K | M | T |
| 40 | 00 | 00 |
| 81 | 12 | 44 |
| 126 | 24 | 112 |
| 139 | 00 | 112 |
| 255 | 00 | 127 |
K is a speed in km/h. The TCU will use the first row for speeds up to 40km/h, the second row for speeds up to 81km/h, the third for speeds up to 126km/h and so on.
T is a TPS signal between 0 and 127. Zero represents no thottle, 127 represents full throttle. In the graphs above, I have converted this figure to a percentage.
The tricky bit, M is the gradient, in 16th's of the line running back from point (K,T) on the graph.
Expressed algebraically, the formula for the graph is: y=T-((M/16)*(K-x)).
where
x is the speed in km/h that you want to know the tps value for.
K,M and T are taken from the appropriate line of the table that corresponds to the speed x.
y is the tps value from 0 to 127.
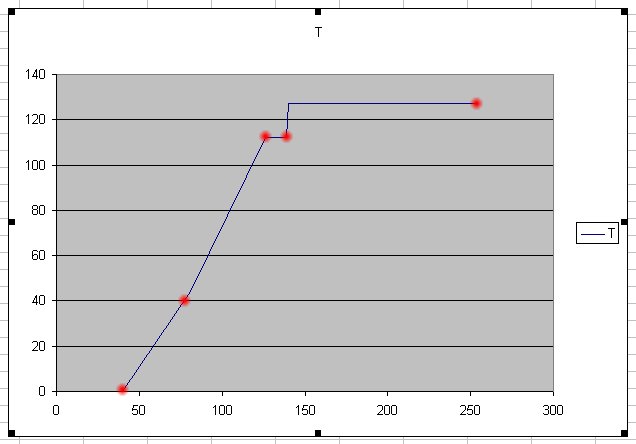 As an example:
Suppose we want to know the tps value of the change point at 100km/h.
We use the third line of the table: x=100, K=126, M=24, T=112.
y=112-((24/16)*(126-100))=73
Converted to a percentage (73*100)/127)=57% thottle. To put it another way, if you are accelerating at 57% throttle, the car will upshift from 2nd to 3rd at 100km/h.
Torque Converter Lockup
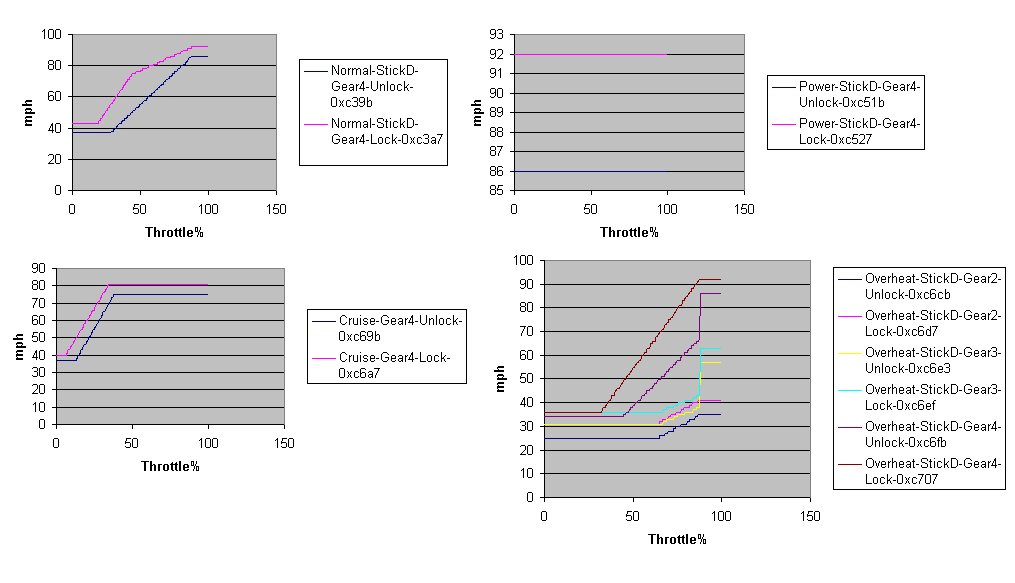
Torque Converter lockup is controlled by maps in a similar way to gearshifting. There are 52 maps in total: 3 modes (Normal, Power, Overheat) multiplied by 4 stick positions ("D","3","2","1") multiplied by 4 gears ("1st","2nd","3rd","4th") makes 48 plus Cruise mode in 4 gears = 52 total.
Each map has a lock curve and an unlock curve. The TC will be locked when the speed rises above the lock curve and unlocked when the speed falls below the unlock curve. The x scale is tps and the y scale is speed. This is the opposite way around the the gear shift maps earlier in the thread. I have converted the scales to a percentage and mph for the picture below.
Most of the maps, for example 1st,2nd and 3rd gear are a straight horizonal line at 159mph. This effectively means "do not lockup the torque converter" because the car is unlikely to ever exceed 159mph in those gears.
The picture below shows some of the maps from a USDM TCU. The top left map is Normal-StickD-Gear4. You can see at 50% throttle, the TC will lock as you accelerate past 77mph and unlock as you decelerate past 55mph. If you were drag racing at 100% throttle, it would lock at 92mph on the way up and unlock at 86mph on the way back down.
It has been mentioned in the "Power Mode Mod" thread that the TC does not lockup in power mode. This is not entirely true. As you can see from the top right map: In 4th gear, it will lock at 92mph and unlock at 86mph in any throttle position.
In the bottom left corner you can see the cruise map, the TC locks up at lower speed and lower throttle for smooth driving and economy.
Finally, in the bottom right corner is a sample of the overheat maps. When the TCU is in overheat mode, it locks up the TC even in 2nd and 3rd gear, not just 4th like the other modes. It has often been said that the TC generates a lot of heat. When the transmission gets too hot, the TCU locks it up whenever possible to try and stop the temperature from rising any further.
How to decode the Torque Converter lockup maps
In order to decode them, first find the list of thirteen 16-bit pointers at address 0xC339 in the USDM TCU. These contain the addresses for the maps for Normal-StickD, Normal-Stick3, Normal-Stick2, Normal-Stick1, Power-StickD, Power-Stick-3, Power-Stick2, Power-Stick1, Cruise, Overheat-StickD, Overheat-Stick3, Overheat-Stick2, Overheat-Stick1.
Next work out an offset as follows: offset=(gear*2+direction)*12
where gear = 0 for "1st", 1 for "2nd", 2 for "3rd", 3 for "4th"
direction = 0 for "Unlock", 1 for "Lock"
Add the offset to the pointer to get the address of the map. For example:
0000C330 xx xx xx xx xx xx xx xx xx C3 53 C3 B3 C4 13 C4
The pointer for Normal-StickD is 0xC353.
0000C340 73 C4 D3 C5 33 C5 93 C5 F3 C6 53 C6 B3 C7 13 C7
0000C350 73 C7 D3 xx xx xx xx xx xx xx xx xx xx xx xx xx
The offset for Gear4-Lock is (3*2+1)*12=84
The address of the map for Normal-StickD-Gear4-Lock is 0xC353+84=0xC3A7
0000C3A0 xx xx xx xx xx xx xx 30 00 46 70 C8 21 E0 40 5C
Arrange the map data into columns of three
0000C3B0 FF 00 94 xx xx xx xx xx xx xx xx xx xx xx xx xx
| T | M | C |
| 30 | 00 | 46 |
| 70 | C8 | 21 |
| E0 | 40 | 5C |
| FF | 00 | 94 |
The T column is TPS signal between 0 and 255. 0 represents no throttle, 255 reprents full throttle. In the graphs above, I converted this to a percentage. The TPS will use the first row of the table for throttle positions up to 0x30 (18%), the second row for throttle up to 0x70 (44%), the third up to 0xE0 (88%) and the last up to 100%
The speed in km/h can be calculated using the formula k=(M/256)*t+C
where t is the throttle postion and M and C are taken from the corresponding row of the table above.
For example, if the throttle position is 40%, t is 102. Select the 2nd row of the table, M=0xC8, C=0x21. The speed is 112km/h which is 70mph.